What a zone measures
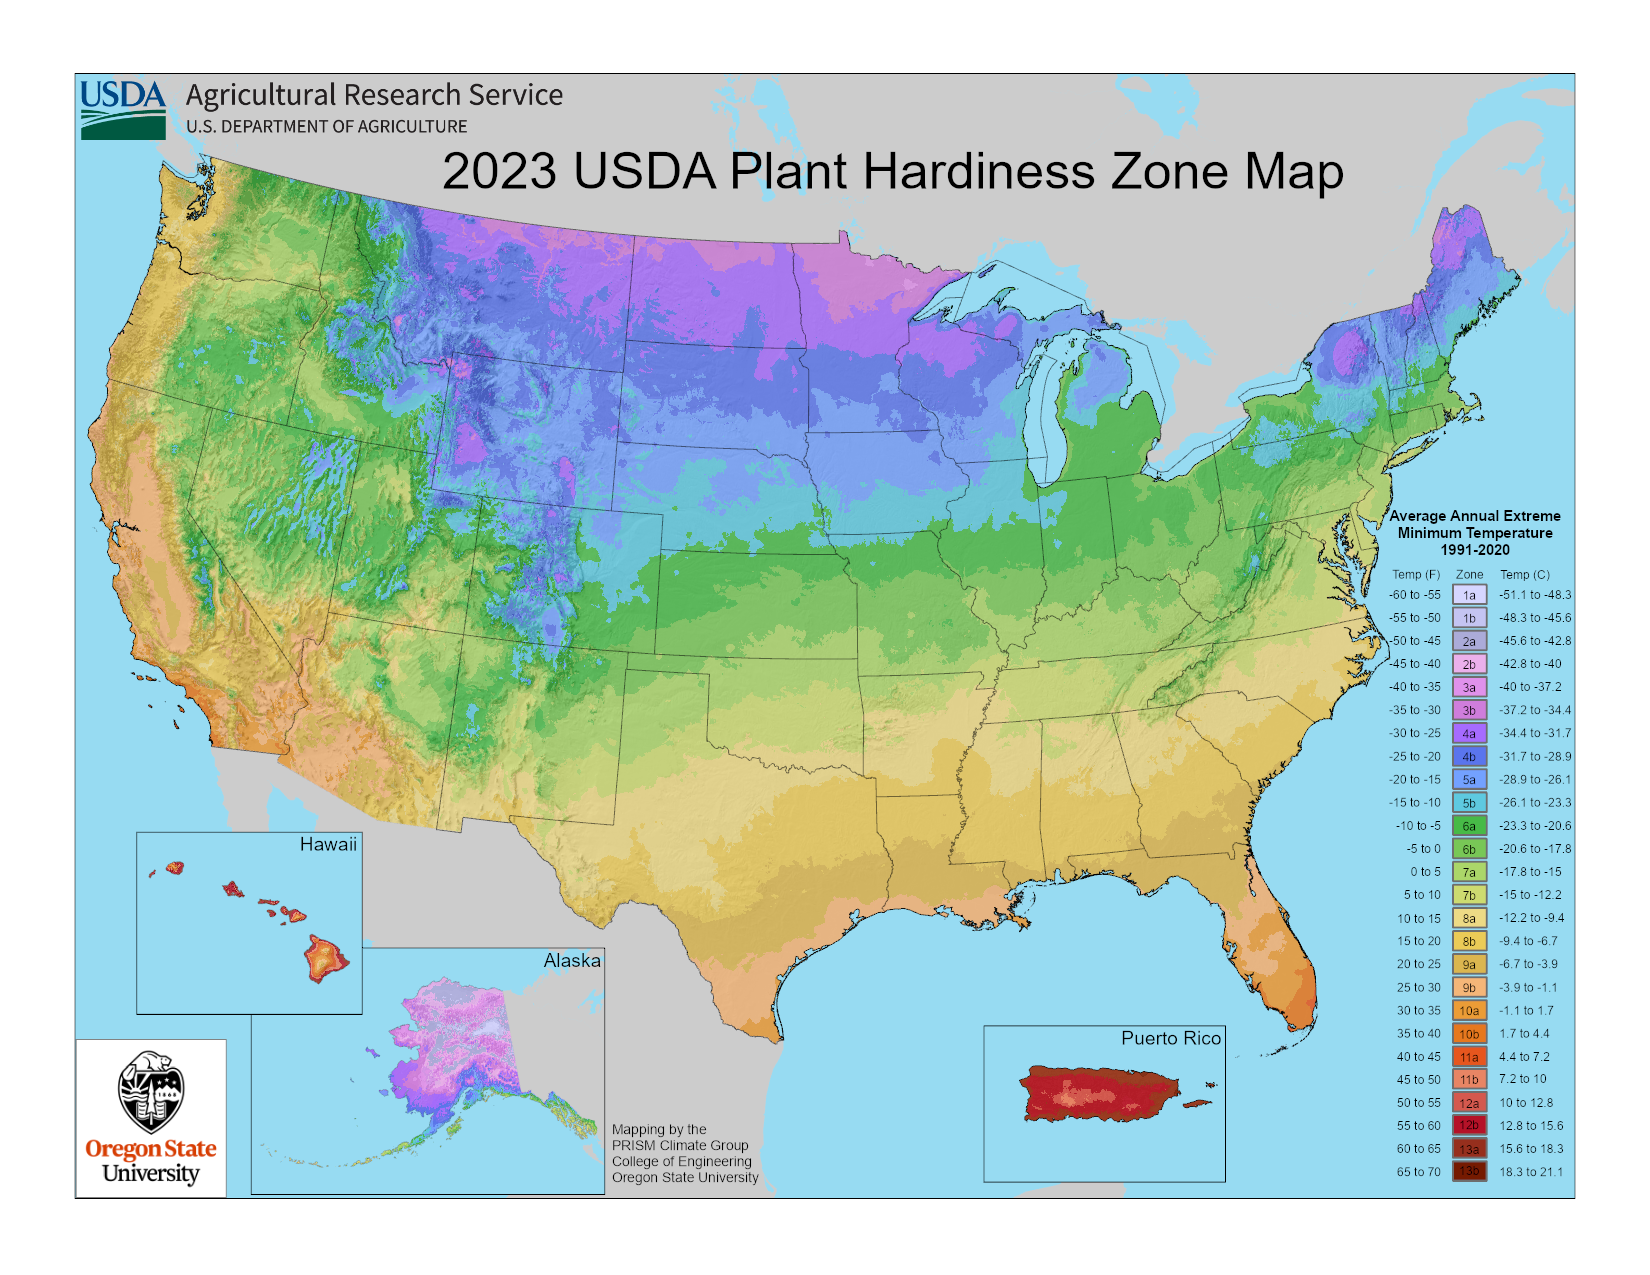
USDA's Agricultural Research Service bases the map on the average annual extreme minimum winter temperature. In plain terms: take the single coldest temperature of each winter at a location, average those over 30 years, and the result decides the zone. The current map, released on November 15, 2023, uses weather station data from 1991 to 2020.
The zones are 10 °F wide and split into 5 °F half zones marked a (the colder half) and b (the warmer half). Zone 1a starts at −60 °F. Zones 12 and 13 cover average extreme lows above 50 °F and 60 °F and appear only on the maps for Hawaii and Puerto Rico.
Gardeners and growers use the map, in USDA's words, to determine which perennial plants are most likely to thrive at a location. That is its whole job.
Find your zone
Enter your ZIP code in the search box on the USDA map site, or click your location on the interactive map. The result shows the half zone and its temperature range. If you garden near a zone boundary, note both your zone and the neighboring one; the line on a map is a smoothed estimate, not a wall.
All zones in °F and °C
The Fahrenheit ranges follow the 2023 map legend. The Celsius values are converted here and match the legend; the temperature converter does the same for any other number.
| Zone | °F | °C |
|---|---|---|
| 1a | −60 to −55 | −51.1 to −48.3 |
| 1b | −55 to −50 | −48.3 to −45.6 |
| 2a | −50 to −45 | −45.6 to −42.8 |
| 2b | −45 to −40 | −42.8 to −40.0 |
| 3a | −40 to −35 | −40.0 to −37.2 |
| 3b | −35 to −30 | −37.2 to −34.4 |
| 4a | −30 to −25 | −34.4 to −31.7 |
| 4b | −25 to −20 | −31.7 to −28.9 |
| 5a | −20 to −15 | −28.9 to −26.1 |
| 5b | −15 to −10 | −26.1 to −23.3 |
| 6a | −10 to −5 | −23.3 to −20.6 |
| 6b | −5 to 0 | −20.6 to −17.8 |
| 7a | 0 to 5 | −17.8 to −15.0 |
| 7b | 5 to 10 | −15.0 to −12.2 |
| 8a | 10 to 15 | −12.2 to −9.4 |
| 8b | 15 to 20 | −9.4 to −6.7 |
| 9a | 20 to 25 | −6.7 to −3.9 |
| 9b | 25 to 30 | −3.9 to −1.1 |
| 10a | 30 to 35 | −1.1 to 1.7 |
| 10b | 35 to 40 | 1.7 to 4.4 |
| 11a | 40 to 45 | 4.4 to 7.2 |
| 11b | 45 to 50 | 7.2 to 10.0 |
| 12a | 50 to 55 | 10.0 to 12.8 |
| 12b | 55 to 60 | 12.8 to 15.6 |
| 13a | 60 to 65 | 15.6 to 18.3 |
| 13b | 65 to 70 | 18.3 to 21.1 |
Read a row like this: in zone 6b, the coldest night of an average winter falls between −5 and 0 °F (−20.6 to −17.8 °C). Some winters are colder than that, some milder.
Using your zone when you buy plants
USDA notes that zone numbers are usually listed with the descriptions of perennial plants in catalogs. A lower zone number means a colder winter, so the check is a comparison of two numbers:
- Plant zone equal to or lower than yours: the plant is rated for a winter at least as cold as your average one. A plant listed for zone 5 in a zone 6b garden is rated for nights down to −20 °F, while your average coldest night is −5 to 0 °F.
- Plant zone higher than yours: your average winter is colder than the plant is rated for. Grow it in a pot you move indoors, in a greenhouse, or as a plant you replace each year.
- Half zones count. If a tag gives a half zone, compare half zones. 6a is 5 °F colder than 6b.
Gardeners sometimes "push" their zone by growing plants rated for the next warmer one. USDA's caution is that the maps are based on the average lowest temperatures, not the lowest ever. A plant rated one zone warmer can survive several mild winters and then die in one cold one.
Plants kept indoors over winter leave the zone question behind and face indoor conditions instead. The plant VPD calculator turns room temperature and humidity into vapor pressure deficit, and the grow light cost calculator estimates the electricity for a light over a winter.
What changed in 2023
The previous map, from 2012, averaged the years 1976 to 2005. The 2023 map uses 1991 to 2020, the same 30-year period climatologists use for current U.S. climate normals, and the news release counts 13,412 weather stations against 7,983 for the 2012 map. USDA's summary of the result:
- About half of the country shifted to the next warmer half zone; the other half stayed in the same half zone.
- The new map is generally about one quarter-zone warmer than the 2012 map throughout much of the United States.
- Some areas came out cooler. USDA attributes the shifts to the newer averaging period together with more station data and improved mapping methods.
USDA adds that changes in zones are not reliable evidence of whether there has been global warming, because the zone depends on one extreme value per year, which can vary a lot from winter to winter.
Microclimates in your own yard
The map is smoothed over a grid, and USDA notes there could be microclimates too small to show up on it. Its examples:
- Small heat islands, for example near blacktop and concrete.
- Cool spots in small hills and valleys, and low spots where cold air pools first.
- A sheltered area in front of a south-facing wall, which can be warmer than the zone around it.
- A whole yard that runs somewhat warmer or cooler than the surrounding area because it is sheltered or exposed.
Use these to place plants. A plant at the edge of your zone has better odds against a sheltered south wall than in the low corner of the yard.
What a zone does not tell you
A zone answers one question about winter cold. USDA lists the factors it could not take into account, and they matter as much for survival:
- Wind, soil type, soil moisture, humidity, pollution, snow and winter sunshine can greatly affect plant survival. Dry soil in late autumn can injure plants that would otherwise be hardy, and high humidity limits cold damage by reducing moisture loss.
- Duration of cold. Many plants that survive a short cold spell do not tolerate a long one.
- Warm spells. Exceptionally warm weather in midwinter followed by a sharp return to cold can injure plants, and so can a cold snap in early fall.
- Summer. USDA notes that warm-season heat and moisture balance also decide whether a plant does well. The zone says nothing about summer heat.
- Frost dates. The zone is not a planting calendar. For when to sow and set out vegetables, see planting vegetables by your last frost date.
USDA calls all hardiness maps general guides. They narrow the list of plants worth trying; local experience, a neighbor's garden or an extension office fills in the rest.
Frequently asked questions
What is a USDA hardiness zone?
A band of average annual extreme minimum winter temperature: the coldest night of each winter, averaged over the years 1991 to 2020 for the current map. Each zone spans 10 °F and is split into two 5 °F half zones, a and b. A plant rated for your zone is expected to survive the typical coldest night where you live.
How do I find my hardiness zone?
Enter your ZIP code in the search box on the USDA Plant Hardiness Zone Map website, or click your location on the interactive map. It returns the zone, the half zone and the temperature range for that spot.
Why did my zone change in 2023?
The 2023 map uses temperatures from 1991 to 2020 instead of 1976 to 2005, more weather stations and better mapping methods. USDA says about half of the country shifted to the next warmer half zone and the other half stayed in the same half zone. USDA also cautions that zone changes are not reliable evidence of global warming.
What do the letters a and b mean?
They split each 10 °F zone into two 5 °F half zones. The a half is the colder one, the b half the warmer one: zone 6a covers average extreme lows of −10 to −5 °F, zone 6b −5 to 0 °F. When a plant tag gives a half zone, compare half zones.
Do zones matter for annual flowers and vegetables?
Much less. USDA describes the map as the tool for deciding which perennial plants are most likely to thrive at a location, because perennials have to survive the winter. Annuals and most vegetables live through one growing season, so for them the frost dates matter more than the winter low.
Sources
- USDA Agricultural Research Service, Plant Hardiness Zone Map home page (based on the average annual extreme minimum winter temperature; 10 °F zones and 5 °F half zones; for choosing perennial plants)
- USDA ARS, 2023 Plant Hardiness Zone Map, national half-zone map with legend (zones 1a at −60 to −55 °F through 13b at 65 to 70 °F, average annual extreme minimum temperature 1991-2020)
- USDA ARS, Map Creation (1991-2020 averaging period; about one quarter-zone warmer than 2012 in much of the country; zones 12 and 13 only for Hawaii and Puerto Rico; zone changes not reliable evidence of global warming)
- USDA ARS, How to Use the Maps (ZIP code search; zone numbers in catalogs for perennials; average lows, not the lowest ever; microclimates; wind, soil, moisture, humidity, snow and winter sun; length of cold; midwinter warm spells)
- USDA ARS news release, USDA Unveils Updated Plant Hardiness Zone Map, November 15, 2023 (1991 to 2020 station data; 13,412 stations against 7,983 for 2012; about half the country shifted to the next warmer half zone)